📌
# MNIST 데이터를 이용하여 숫자를 학습하여 숫자 인식하기.
# MNIST 데이터셋 다운받기
from tensorflow.keras.datasets.mnist import load_data
(x_train, y_train),(x_test, y_test)=\\
    load_data(path='mnist.npz')
x_train.shape  # (60000, 28, 28), 훈련데이터
y_train.shape  # (60000,)
x_test.shape  # (10000, 28, 28), 테스트데이터
y_test.shape  # (10000,)

import matplotlib.pyplot as plt
import numpy as np
# 0~59999 사이의 임의의 수 3개
random_idx = np.random.randint(60000,size=3)
for idx in random_idx :
    img = x_train[idx,:]
    label=y_train[idx]
    plt.figure()
    plt.imshow(img)
    plt.title\\
  ('%d-th data, label is %d' % (idx,label),fontsize=15)
# 검증데이터 생성 : 학습 중간에 평가를 위한 데이터
from sklearn.model_selection import train_test_split
x_train,x_val,y_train,y_val = train_test_split\\
    (x_train,y_train,test_size=0.3, random_state=777)
x_train.shape  # (42000, 28, 28)
x_val.shape    # (18000, 28, 28)
# 데이터 정규화
'''
  MinMax normalization : X = (x-min)/(max-min)
  Robust mormalization : X=(x-중간값)/(3분위값-1분위값)
  Standardization      : X=x-평균값/표준편차
'''
x_train[0]

# MinMax normalization 정규화
# 현재데이터 : min:0, max=255
x_train = (x_train.reshape(42000,28*28))/255
x_val = (x_val.reshape(18000,28*28))/255
x_test = (x_test.reshape(10000,28*28))/255
x_train[0]
x_train.shape # (42000, 784)
x_val.shape   # (18000, 784)
x_test.shape  # (10000, 784)
y_train[:10]
# 레이블 전처리:one-hot 인코딩하기
from tensorflow.keras.utils import to_categorical
y_train=to_categorical(y_train)
y_train[:10]
y_val=to_categorical(y_val)
y_test=to_categorical(y_test)
# 모델 구성하기
from tensorflow.keras.models import Sequential
from tensorflow.keras.layers import Dense
model = Sequential()  # 모델 생성
model.add(Dense(64,activation="relu",input_shape=(784,)))
model.add(Dense(32,activation="relu"))
model.add(Dense(10,activation="softmax"))
'''
  1층 :
    64 : 출력노드 갯수
    input_shape=(784,) : 입력노드의 갯수
    activation="relu" : 활성화 함수. 0이상의 값
  2층 :
    32 : 출력노드 갯수
    activation="relu" : 활성화 함수. 0이상의 값
    입력노드갯수 : 1층의 출력노드갯수.64개
  3층 :
    10 : 출력노드 갯수. 0~9까지의 수. 다중분류 모델
    activation="softmax" : 활성화 함수.
                    다중분류 방식에서 사용되는 활성화 함수
    입력노드갯수 : 2층의 출력노드갯수.32개
'''
model.summary()
'''
Param # : 가중치 편향의 갯수
1층 : (784 + 1) * 64 = 50240
2층 : (64 + 1) * 32 = 2080
3층 : (32 + 1) * 10 = 330
Total params: 52,650
'''
model.compile(optimizer="adam", loss='categorical_crossentropy',
              metrics=['acc'])
'''
optimizer="adam" : 경사하강법 알고리즘 이름.
                   Adam 클래스로도 가능 => import 해야함
loss='categorical_crossentropy'  : 손실함수 종류.
                   label(정답) ont-hot 인코딩 되어야함
     mse : 평균제곱오차.
     categorical_crossentropy : 다중분류에서 사용되는 손실함수
            => 활성화함수 : softmax 와 보통 같이 사용됨
     binary_crossentropy : 이진분류에서 사용되는 손실함수
            => 활성화함수 : sigmoid 와 보통 같이 사용됨
metrics=['acc'] : 평가지표.
'''
📌
# 학습하기
history=model.fit(x_train,y_train,epochs=30,batch_size=127,
                  validation_data=(x_val,y_val))
'''
epochs=30 : 30번 학습하기.
batch_size=127 : 데이터를 127개로 분리.기본값:32
             42000/127=330.7086614173228
validation_data=(x_val,y_val) : 검증데이터 설정.
history : 학습 과정을 저장한 데이터
'''
history.history["loss"] # 훈련데이터 손실함수값
len(history.history["loss"])
history.history["acc"] # 훈련데이터 정확도
history.history["val_loss"] # 검증데이터 손실함수값
history.history["val_acc"] # 검증데이터 정확도값
type(history.history) # dict
# 결과 시각화 하기
import matplotlib.pyplot as plt
his_dict = history.history
loss = his_dict['loss']  # 훈련데이터 학습시 손실함수값
val_loss = his_dict['val_loss'] # 검증데이터 학습시 손실함수값
epochs = range(1, len(loss) + 1) # 1 ~ 30까지의 숫자
fig = plt.figure(figsize = (10, 5))
ax1 = fig.add_subplot(1, 2, 1) # 1행2열의 1번째 그래프영역
ax1.plot(epochs, loss, color = 'blue', label = 'train_loss')
ax1.plot(epochs, val_loss, color = 'orange', label = 'val_loss')
ax1.set_title('train and val loss')
ax1.set_xlabel('epochs')
ax1.set_ylabel('loss')
ax1.legend()

# 정확도 그래프
acc = his_dict['acc'] # 훈련데이터 정확도값
val_acc = his_dict['val_acc'] # 검증데이터 정확도값
ax2 = fig.add_subplot(1, 2, 2) # 1행2열의 2번째 그래프 영역
ax2.plot(epochs, acc, color = 'blue', label = 'train_acc')
ax2.plot(epochs, val_acc, color = 'orange', label = 'val_acc')
ax2.set_title('train and val acc')
ax2.set_xlabel('epochs')
ax2.set_ylabel('acc')
ax2.legend()
plt.show()
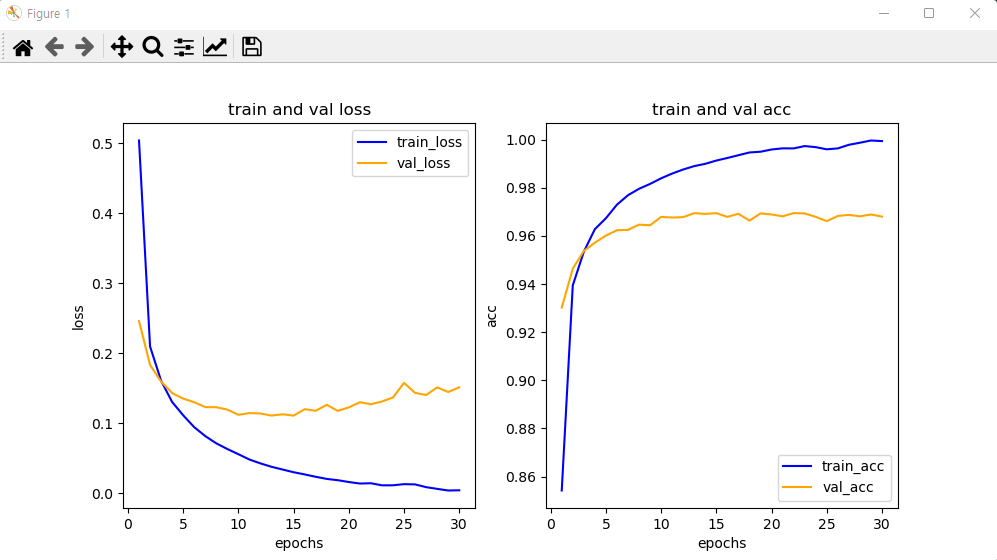
'''
   과적합현상 발생 : 훈련을 너무 많이함.
            훈련을 해도 검증 데이터의 평가지수가 개선 안됨.
'''
loss[29]     # 0.00736351078376174
val_loss[29] # 0.14246465265750885
acc[29]      # 0.9978333115577698
val_acc[29]  # 0.9711111187934875

# 모델 평가
# [0.13174931704998016, 0.9735000133514404]
# [손실함수값, 정확도]
model.evaluate(x_test,y_test)

# 예측하기
results = model.predict(x_test)
results[0] #7. 99%
np.argmax(results,axis=1)[0] #7
y_test[0]  #7
results[1] #2. 100%
y_test[1]  #2
np.argmax(results,axis=1)[1] #2
# np.argmax : results 데이터중 가장 큰값의
#             인덱스 가 예측 숫자임.
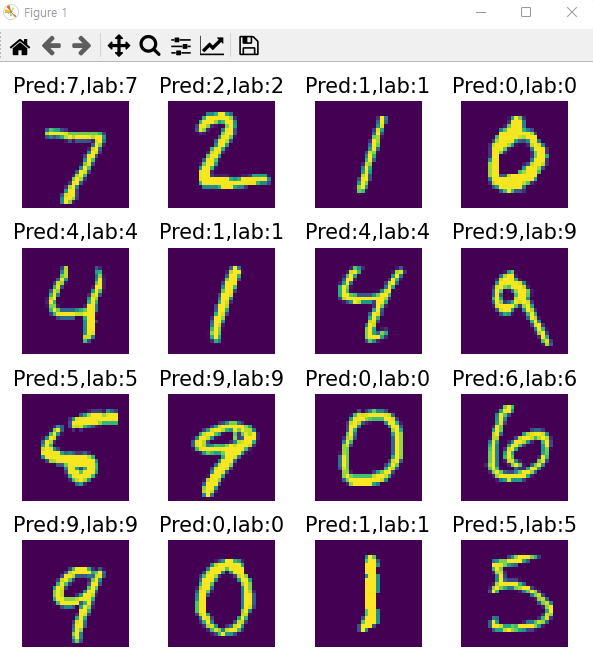
# 이미지 출력
arg_results = np.argmax(results,axis=1) #예측데이터 최대 인덱스 값들
arg_results[0]
plt.figure(figsize=(6,6))
for idx in range(16) : #0~15까지
    plt.subplot(4, 4, idx+1)  #4행4열
    plt.axis('off')
    plt.imshow(x_test[idx].reshape(28, 28)) #2차원배열. 그래프
    plt.title('Pred:%d,lab:%d' % \\
(arg_results[idx],np.argmax(y_test[idx],axis=-1)),fontsize=15)
plt.tight_layout()
plt.show()
# 혼동행렬 조회하기
from sklearn.metrics import \\
    classification_report,confusion_matrix
cm=confusion_matrix(np.argmax(y_test,axis=-1),\\
                    np.argmax(results,axis=-1))
cm
classification_report(np.argmax(y_test,axis=-1),\\
                    np.argmax(results,axis=-1))

#heatmap으로 출력하기
import seaborn as sns
plt.figure(figsize=(7,7))
sns.heatmap(cm,annot=True,fmt='d',cmap='Blues')
plt.xlabel('predicted label',fontsize=15)
plt.ylabel('true label',fontsize=15)
plt.show()

'''
  소프트맥스, 시그모이드 함수 구현하기
  소프트맥스 : 값들간의 영향을 줌. 다중분류에서 많이 사용됨
              결과값의 합은 1
  시그모이드 : 값들간의 영향 없음. 0~1사이의 값.
'''
import numpy as np
def softmax(arr) :
    m = np.max(arr)
    arr = arr -m
    arr = np.exp(arr)
    return arr/np.sum(arr)
def sigmoid(x) :
    return 1/(1+np.exp(-x))

case1 = np.array([3.1,3.0,2.9])
case2 = np.array([2.0,1.0,0,0.7])

print("sigmoid:",sigmoid(case1),"softmax:",softmax(case1))
# sigmoid: [0.95689275 0.95257413 0.94784644]
# softmax: [0.3671654  0.33222499 0.30060961]
sum(softmax(case1)) #1.0
print("sigmoid:",sigmoid(case2),"softmax:",softmax(case2))
# sigmoid: [0.88079708 0.73105858 0.5        0.66818777]
# softmax: [0.56314344 0.20716889 0.07621318 0.15347449]
sum(softmax(case2)) #1.0
'수업(국비지원) > Python' 카테고리의 다른 글
| [Python] 2023-01-02 복습 (0) | 2023.04.27 |
|---|---|
| [Python] Fashion-MNIST 데이터를 이용하여 예측 평가하기 (0) | 2023.04.27 |
| [Python] Tensortflow (0) | 2023.04.27 |
| [Python] 딥러닝 - 가중치와 편향, 다중 퍼센트론 (0) | 2023.04.27 |
| [Python] 딥러닝 - 인공신경망(ANN) (0) | 2023.04.27 |


