'''
2022-12-09 복습

  범주형 데이터 : 값의 범위를 가진 데이터.
                describe() 함수에서 조회시 제외.
  날짜 데이터 : pandas.date_range() : 날짜값을 범위 지정해서 조회
               df["Date"] : datetime 형
               df["Date"].dt.year : 년도
               df["Date"].dt.month : 월
               df["Date"].dt.day : 일
  형변환 : astype("자료형")   : str,int,float,category....
  str : DataFrame의 요소들을 문자열처럼 사용. 문자열 함수 사용가능
              df["aaa"].str.startsWidth("")...

  === 그룹화 : DataFrame을 컬럼의 값으로 데이터 분리
  groupby(컬럼명) : DataFrame 객체를 컬럼명의 값으로 분리.
  agg(함수)      : 지정한 함수를 적용할 수 있도록 하는 함수. 사용자정의함수 사용가능
  filter(조건함수) : 조건함수의 결과가 참인 경우인 데이터 추출

  === 병합 : 두개의 DataFrame 연결
  concat : 물리적을 연결. 병합의 의미는 아니다.
  merge  : 연결컬럼의 값을 기준으로 같은 값은 가진 레코드들을 연결.
            merge(df1,df2,on="연결컬럼",[how="outer/left/right"])

           두개의 데이터의 연결 컬럼명이 다른 경우
            merge(df1,df2,left_on="왼쪽데이터 연결컬럼", right_on="오른쪽데이터연결컬럼"
                  [how="outer/left/right"])
'''
📌
###############
# BeautifulSoup : html,xml 파싱해주는 모듈.(태그 분석 모듈)
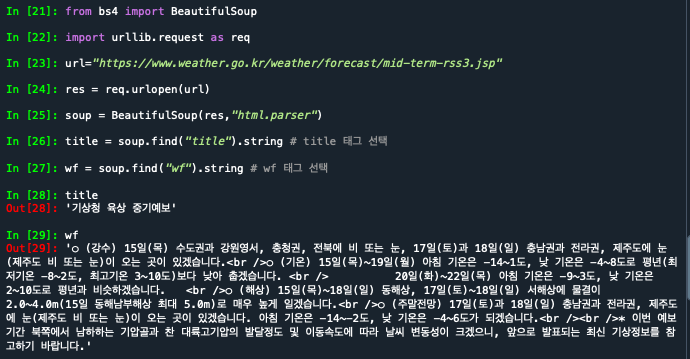
from bs4 import BeautifulSoup
import urllib.request as req # 요청을 하여 서버에서 결과를 수신하는 모듈
url="<https://www.weather.go.kr/weather/forecast/mid-term-rss3.jsp>"
# res : 요청 결과 데이터
res = req.urlopen(url) # url에 해당하는 주소로 요청
# soup 객체에 res 데이터 분석(파싱한다.)결과
soup = BeautifulSoup(res,"html.parser")
title = soup.find("title").string # title 태그 선택
wf = soup.find("wf").string # wf 태그 선택
title
wf
# wf 데이터를 <br /> 문자열로 분리하여 화면에 출력
for w in wf.split("<br />") :
    print(w)

# 인터넷에서 수신된 내용을 forecast.xml 파일로 저장하기
import os.path
# os.path.exists : 파일이 존재?
if not os.path.exists("data/forecast.xml") :
    # urlretrieve : 인터넷을 통해 전달받은 데이터를 파일로 저장
    # urlretrieve(url, 저장할 파일 이름)
    req.urlretrieve(url,"data/forecast.xml")
# forecast.xml 파일을 읽어서 BeautifulSoup 객체로 분석하기
fp = open("data/forecast.xml",encoding="utf-8")
#1
soup = BeautifulSoup(fp, "html.parser")
# select_one : 태그 한개 선택.
# rss pubDate : rss 태그의 하위 태그 중 pubDate 태그 선택
pubdate = soup.select_one("rss pubDate").string
pubdate

#2
# select : 태그 여러개를 리스트로 리턴.
rss = soup.select("rss")[0] # rss 태그들 중 첫번째.
                            # (태그들로 인식하기때문에 []사용))
# 첫번째 rss 태그의 하위 태그 중 pubDate 태그의 내용
pubdate = rss.select_one("pubDate").string
pubdate

# location 태그들의 하위 태그 중 한개의 city, wf 태그의 내용 출력하기
#1-1
for location in soup.select("location") :
    # location : location 태그 한개
    city = location.select_one("city").string
    wf = location.select_one("wf").string
    print(city,wf)

#1-2
for location in soup.select("location") :
    # location : location 태그 한개
    city = location.select_one("city").string
    wf = location.select_one("wf").string
    tmn = location.select_one("tmn").string
    tmx = location.select_one("tmx").string
    print(city,wf,tmn,tmx)

#2
# find_all : location 태그들
# find : city 태그 한개
for location in soup.find_all("location") :
     # location : location 태그 한개
     city = location.select_one("city").string
     wf = location.select_one("wf").string
     tmn = location.select_one("tmn").string
     tmx = location.select_one("tmx").string
     print(city,wf,tmn,tmx)

📌
# 네이버 환율정보 조회하기
url = "<http://finance.naver.com/marketindex/>"
res = req.urlopen(url)
soup = BeautifulSoup(res,"html.parser") # DOM tree
# sel 함수 정의 : 람다방식
sel = lambda q : soup.select(q)
# div.head_info : div 태그 중 class 속성이 head_info 태그들
hlist = sel("div.head_info") # 환율정보 태그들
print(hlist)
htitle = sel("h3.h_lst") # 통화명 태그들
print(htitle)

######
# 그래프 출력을 위해서 데이터 저장
taglist = [] # 상승/하락값
titlelist = [] # 통화명
for tag, title in zip(hlist, htitle) :
    # tag : 환율 정보, title : 통화명
    print(title.select_one("span.blind").string, end="\\t")
    value = tag.select_one("span.value").string # 환율정보
    print(value, end=" ")
    change = tag.select_one("span.change").string # 상승/하락값
    print(change, end="\\t")
    blinds = tag.select("span.blind") # 통화단위
    b = tag.select("span.blind")[0].string # 첫번째 통화단위
    b = tag.select("span.blind")[-1].string # 상승,하락
    print(b, end="*******\\n")
    if b == '하락' :
        taglist.append(float(change) * -1) # 하락인 경우 음수로 표시
    else :
        taglist.append(float(change))
    # 통화국가명 titlelist에 추가
    titlelist.append(title.select_one("span.blind").string)

print(taglist)
print(titlelist)

# 국내 금 데이터 제외하기.
titlelist = titlelist[:-1]
taglist = taglist[:-1]

print(taglist)
print(titlelist)

# 상승/하락여부 그래프로 출력하기
import matplotlib.pyplot as plt
from matplotlib import rc
plt.style.use("ggplot")
plt.rcParams['axes.unicode_minus']=False # 음수표시
rc('font', family='Malgun Gothic') # 한글폰트
xlab = range(len(titlelist))
plt.bar(xlab,taglist) # 막대그래프
plt.plot(xlab,taglist) # 선그래프
# x축 설정. xlab x축의 값을 titlelist의 값으로 변경.
# rotation = 'vertical' : 세로표시
plt.xticks(xlab,titlelist,rotation='vertical')

'수업(국비지원) > Python' 카테고리의 다른 글
| [Python] chipo.tsc 파일 분석하기2 (0) | 2023.04.26 |
|---|---|
| [Python] chipo.tsc 파일 분석하기1 (0) | 2023.04.26 |
| [Python] 반정형 데이터 - BeautifulSoup 모듈1 (0) | 2023.04.26 |
| [Python] 두개의 DataFrame 연결하기 (0) | 2023.04.26 |
| [Python] filter(조건) 함수 (0) | 2023.04.25 |


