📌
# 파이그래프
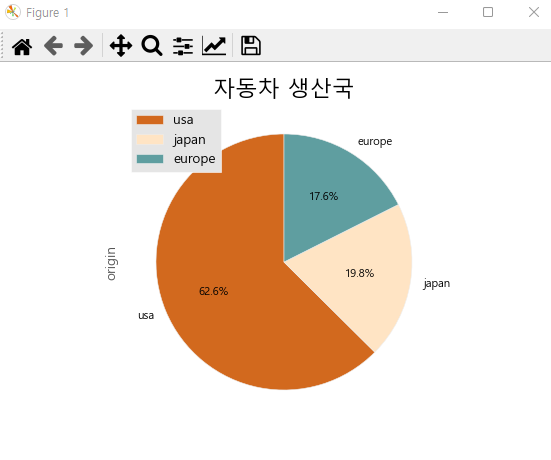
# origin 컬럼 : 제조국. [usa,japan,europe]
df_origin = df.origin.value_counts()
df_origin
type(df_origin)
#1
df_origin.plot(kind="pie") # 파이그래프
plt.title("자동차 생산국",size=20)
plt.legend(labels=df_origin.index, loc="upper left")

#2
# autopct="%.1f%%" : 파이그래프에 비율 표시
#                    %1.f : 소숫점 이하 1자리로 표시
#                    %% : %문자를 의미.
# startangle=90 : 기본설정 위치에서 90도로 시작위치를 변경
df_origin.plot(kind="pie", figsize=(7,5), autopct="%.1f%%",
               startangle=90,colors=['chocolate','bisque','cadetblue']) # 파이그래프
plt.title("자동차 생산국",size=20)
plt.legend(labels=df_origin.index, loc="upper left")
'수업(국비지원) > Python' 카테고리의 다른 글
| [Python] seaborn 모듈 - 시각화 모듈 선형회귀 그래프 (0) | 2023.04.25 |
|---|---|
| [Python] matplot 시각화 모듈 - 박스그래프 (0) | 2023.04.25 |
| [Python] matplot 시각화 모듈 - 연합 막대그래프 (0) | 2023.04.25 |
| [Python] 시각화 (0) | 2023.04.25 |
| [Python] seaborn (조회, 정렬) (0) | 2023.04.25 |


